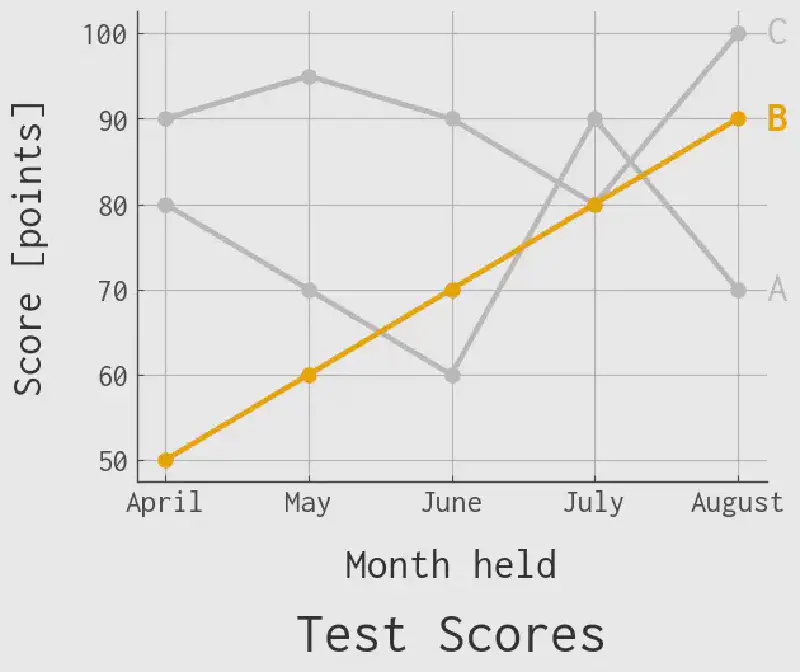
これはなに

Pythonのmatplotlibライブラリを利用して、プレゼン資料へ載せるのに適した折れ線グラフを描いた。 その際に取った過程を残しておくもの。
これをこうじゃ。
はじめに

似たようなことは下記ですでにやられている。
また、この記事で描いたグラフを簡単に描くためのパッケージ「rei-preso-plot」もPyPIで公開している。 この先の長い文章を読むのが面倒になったら使ってみてほしい。
結論 | 最終的にできたコード

先にAfterのグラフを表示するコードを示しておく。とても長いので折りたたんでいる。
Afterのグラフを表示するコード
from matplotlib import pyplot as plt
from numpy.typing import ArrayLike
from cycler import cycler

fontsize_title: float = 32.0
fontsize_label: float = 24.0
fontsize_legend: float = 24.0
fontsize_tick: float = 18.0

color_face: str = "#fafafa"
color_title: str = "#282828"
color_label: str = "#282828"
color_legend: str = "#282828"
color_grid: str = "#c0c0c0"
color_tick: str = "#424242"
colors: list[str] = [
    "#005aff",
    "#f6aa00",
    "#03af7a",
    "#ff4b00",
    "#9467bd",
    "#804000",
    "#ff8082",
    "#84919e",
    "#fff100",
    "#4dc4ff",
]
focus_indexes: list[int] = [1]
focus_color: str = colors[1]
not_focus_color: str = "#c3c3c3"

plt.rcParams["font.family"] = "Ricty diminished"

data_num: int = len(y_data)
colors: list[str] = [not_focus_color] * data_num
z_orders: list[int] = [1] * data_num
font_weights: list[str] = ["normal"] * data_num

if focus_indexes is not None and 0 < len(focus_indexes):
    for index, focus_index in enumerate(focus_indexes):
        if data_num <= focus_index:
            raise ValueError(f'"focus_index" {focus_index} is out of range.')
        colors[focus_index] = focus_color
        z_orders[focus_index] = 2
        font_weights[focus_index] = "bold"

fig = plt.figure(facecolor=color_face)
ax = fig.add_subplot(111)
ax.set_facecolor(color_face)
ax.set_prop_cycle(cycler("color", colors))
for index, y in enumerate(y_data):
    ax.plot(
        x_data,
        y,
        linewidth=3.0,
        marker="o",
        markersize=8.0,
        zorder=z_orders[index],
    )
ax.set_title(
    title,
    fontsize=fontsize_title,
    pad=fontsize_title * 0.75,
    color=color_title,
    y=-0.45,
)
ax.set_xlabel(
    x_label,
    fontsize=fontsize_label,
    labelpad=fontsize_label * 0.75,
    color=color_label,
)
ax.set_ylabel(
    y_label,
    fontsize=fontsize_label,
    labelpad=fontsize_label * 0.75,
    color=color_label,
)
for index, legend in enumerate(legends):
    x_loc: float = (len(x_data) - 1.0) + len(x_data) * 0.04
    ax.text(
        x_loc,
        ax.lines[index].get_data()[1][-1],
        legend,
        color=colors[index],
        va="center",
        fontsize=fontsize_legend,
        fontweight=font_weights[index],
        zorder=z_orders[index],
    )
ax.tick_params(axis="x", labelsize=fontsize_tick, pad=4.5, colors=color_tick)
ax.tick_params(axis="y", labelsize=fontsize_tick, pad=4.5, colors=color_tick)
ax.grid(True, which="both", color=color_grid)
ax.set_axisbelow(True)
ax.tick_params(which="both", direction="in")
ax.spines["top"].set_visible(False)
ax.spines["right"].set_visible(False)
ax.spines["left"].set_linewidth(1.0)
ax.spines["bottom"].set_linewidth(1.0)
ax.spines["left"].set_color(color_tick)
ax.spines["bottom"].set_color(color_tick)
fig.show()
fig.savefig(
    f"result/012.png",
    bbox_inches="tight",
    pad_inches=0.1,
)変遷の過程は次のとおりである。
本稿で初期設定する値

使うパッケージは次のとおりである。
from matplotlib import pyplot as plt
from numpy.typing import ArrayLike
from cycler import cycler本稿のすべてのグラフについて、グラフとして表示するデータは下記とする。
y_data: ArrayLike = [
    [80, 70, 60, 90, 70],
    [50, 60, 70, 80, 90],
    [90, 95, 90, 80, 100],
]
x_data: ArrayLike = ["April", "May", "June", "July", "August"]
legends: ArrayLike = ["A", "B", "C"]
title: str = "Test Scores"
x_label: str = "Month held"
y_label: str = "Score [points]"グラフの改変過程

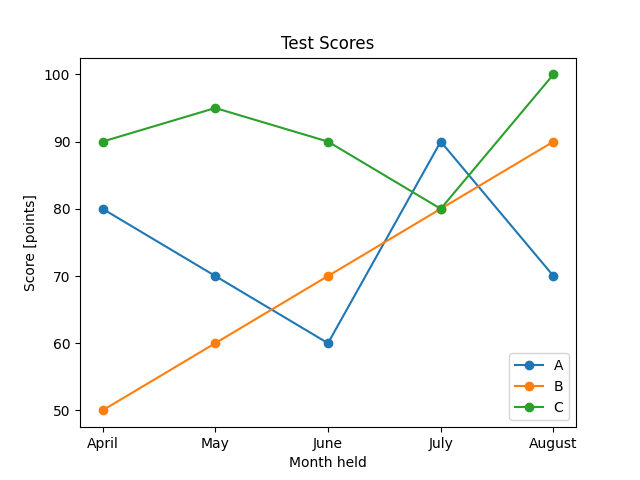
デフォルトのグラフ

Beforeのグラフを表示するコード。matplotlibで特に何も設定せずグラフを描くとこうなる。
fig = plt.figure()
ax = fig.add_subplot(111)
for y in y_data:
    ax.plot(x_data, y, marker="o")
ax.set_title(title)
ax.set_xlabel(x_label)
ax.set_ylabel(y_label)
ax.legend(legends)
fig.show()
fig.savefig(f"result/000.png")フォントを変更する

プレゼンで使うフォントと、グラフで使うフォントを統一する。 筆者はコードの表示にRicty diminishedを使うため、それに合わせている。
plt.rcParams["font.family"] = "Ricty diminished"フォントを変更したコード全体
plt.rcParams["font.family"] = "Ricty diminished"

fig = plt.figure()
ax = fig.add_subplot(111)
for y in y_data:
    ax.plot(x_data, y, marker="o")
ax.set_title(title)
ax.set_xlabel(x_label)
ax.set_ylabel(y_label)
ax.legend(legends)
fig.show()
fig.savefig(f"result/001.png")線の幅とマーカーの大きさを変更する

線の幅とマーカーの大きさを見やすいサイズに変更する。
for y in y_data:
ax.plot(x_data, y, linewidth=3.0, marker="o", markersize=8.0)線の幅とマーカーの大きさを変更したコード全体
plt.rcParams["font.family"] = "Ricty diminished"

fig = plt.figure()
ax = fig.add_subplot(111)
for y in y_data:
    ax.plot(x_data, y, linewidth=3.0, marker="o", markersize=8.0)
ax.set_title(title)
ax.set_xlabel(x_label)
ax.set_ylabel(y_label)
ax.legend(legends)
fig.show()
fig.savefig(f"result/002.png")補助線を引く

具体的数値をきちんと示したいグラフの場合は、補助線を引いたほうが見やすくなる。
ax.grid(True, which="both")
ax.set_axisbelow(True) # グラフの上に補助線が来ないようにする補助線を引いたコード全体
plt.rcParams["font.family"] = "Ricty diminished"

fig = plt.figure()
ax = fig.add_subplot(111)
for y in y_data:
    ax.plot(x_data, y, linewidth=3.0, marker="o", markersize=8.0)
ax.set_title(title)
ax.set_xlabel(x_label)
ax.set_ylabel(y_label)
ax.legend(legends)
ax.grid(True, which="both")
ax.set_axisbelow(True)
fig.show()
fig.savefig(f"result/003.png")枠を消す

上と右の枠線を消す。これだけでも見た目がシンプルになる。 もし数値が重要でないなら、補助線を引かず、左の枠線も消すとよりよくなる。
ax.spines["top"].set_visible(False)
ax.spines["right"].set_visible(False)枠を消したコード全体
plt.rcParams["font.family"] = "Ricty diminished"

fig = plt.figure()
ax = fig.add_subplot(111)
for y in y_data:
    ax.plot(x_data, y, linewidth=3.0, marker="o", markersize=8.0)
ax.set_title(title)
ax.set_xlabel(x_label)
ax.set_ylabel(y_label)
ax.legend(legends)
ax.grid(True, which="both")
ax.set_axisbelow(True)
ax.spines["top"].set_visible(False)
ax.spines["right"].set_visible(False)
fig.show()
fig.savefig(f"result/004.png")枠線を太くする

逆に表示する枠線は、枠線が引いてあるのがわかりやすくなるよう太くする。
ax.spines["left"].set_linewidth(1.0)
ax.spines["bottom"].set_linewidth(1.0)枠線を太くしたコード全体
plt.rcParams["font.family"] = "Ricty diminished"

fig = plt.figure()
ax = fig.add_subplot(111)
for y in y_data:
    ax.plot(x_data, y, linewidth=3.0, marker="o", markersize=8.0)
ax.set_title(title)
ax.set_xlabel(x_label)
ax.set_ylabel(y_label)
ax.legend(legends)
ax.grid(True, which="both")
ax.set_axisbelow(True)
ax.spines["top"].set_visible(False)
ax.spines["right"].set_visible(False)
ax.spines["left"].set_linewidth(1.0)
ax.spines["bottom"].set_linewidth(1.0)
fig.show()
fig.savefig(f"result/005.png")目盛りを内側にする

デフォルトでは外側になっている目盛り線を内側にする。 正直これは好みだと思う。
ax.tick_params(which="both", direction="in")目盛りを内側にしたコード全体
plt.rcParams["font.family"] = "Ricty diminished"

fig = plt.figure()
ax = fig.add_subplot(111)
for y in y_data:
    ax.plot(x_data, y, linewidth=3.0, marker="o", markersize=8.0)
ax.set_title(title)
ax.set_xlabel(x_label)
ax.set_ylabel(y_label)
ax.legend(legends)
ax.grid(True, which="both")
ax.set_axisbelow(True)
ax.tick_params(which="both", direction="in")
ax.spines["top"].set_visible(False)
ax.spines["right"].set_visible(False)
ax.spines["left"].set_linewidth(1.0)
ax.spines["bottom"].set_linewidth(1.0)
fig.show()
fig.savefig(f"result/006.png")凡例をグラフに埋め込む

プレゼンでは、凡例とグラフを行ったり来たりするのはあまりよくない。そのため、凡例をグラフに埋め込む。
# ax.legend(legends)colors = plt.rcParams["axes.prop_cycle"].by_key()["color"]
for index, legend in enumerate(legends):
x_loc: float = (len(x_data) - 1.0) + len(x_data) * 0.04
ax.text(
x_loc,
ax.lines[index].get_data()[1][-1],
legend,
color=colors[index],
va="center",
)凡例をグラフに埋め込んだコード全体
colors = plt.rcParams["axes.prop_cycle"].by_key()["color"]

plt.rcParams["font.family"] = "Ricty diminished"

fig = plt.figure()
ax = fig.add_subplot(111)
for y in y_data:
    ax.plot(x_data, y, linewidth=3.0, marker="o", markersize=8.0)
ax.set_title(title)
ax.set_xlabel(x_label)
ax.set_ylabel(y_label)
# ax.legend(legends)
for index, legend in enumerate(legends):
    x_loc: float = (len(x_data) - 1.0) + len(x_data) * 0.04
    ax.text(
        x_loc,
        ax.lines[index].get_data()[1][-1],
        legend,
        color=colors[index],
        va="center",
    )
ax.grid(True, which="both")
ax.set_axisbelow(True)
ax.tick_params(which="both", direction="in")
ax.spines["top"].set_visible(False)
ax.spines["right"].set_visible(False)
ax.spines["left"].set_linewidth(1.0)
ax.spines["bottom"].set_linewidth(1.0)
fig.show()
fig.savefig(f"result/007.png")文字の大きさを変更する

文字の大きさを見やすいように変更する。
fontsize_title: float = 32.0
fontsize_label: float = 24.0
fontsize_legend: float = 24.0
fontsize_tick: float = 18.0ax.set_title(title, fontsize=fontsize_title)
ax.set_xlabel(x_label, fontsize=fontsize_label)
ax.set_ylabel(y_label, fontsize=fontsize_label)
for index, legend in enumerate(legends):
x_loc: float = (len(x_data) - 1.0) + len(x_data) * 0.04
ax.text(
x_loc,
ax.lines[index].get_data()[1][-1],
legend,
color=colors[index],
va="center",
fontsize=fontsize_legend,
)
ax.tick_params(axis="x", labelsize=fontsize_tick)
ax.tick_params(axis="y", labelsize=fontsize_tick)なお、文字の大きさを変更すると、fig.savefigで保存した際に見切れてしまう。
それを阻止するために、fig.savefigする際は下記を追記する。
fig.savefig(
f"result/008.png",
bbox_inches="tight",
pad_inches=0.1,
)文字の大きさを変更したコード全体
fontsize_title: float = 32.0
fontsize_label: float = 24.0
fontsize_legend: float = 24.0
fontsize_tick: float = 18.0
colors = plt.rcParams["axes.prop_cycle"].by_key()["color"]
plt.rcParams["font.family"] = "Ricty diminished"
fig = plt.figure()
ax = fig.add_subplot(111)
for y in y_data:
ax.plot(x_data, y, linewidth=3.0, marker="o", markersize=8.0)
ax.set_title(title, fontsize=fontsize_title)
ax.set_xlabel(x_label, fontsize=fontsize_label)
ax.set_ylabel(y_label, fontsize=fontsize_label)
for index, legend in enumerate(legends):
    x_loc: float = (len(x_data) - 1.0) + len(x_data) * 0.04
    ax.text(
        x_loc,
        ax.lines[index].get_data()[1][-1],
        legend,
        color=colors[index],
        va="center",
        fontsize=fontsize_legend,
    )
ax.tick_params(axis="x", labelsize=fontsize_tick)
ax.tick_params(axis="y", labelsize=fontsize_tick)
ax.grid(True, which="both")
ax.set_axisbelow(True)
ax.tick_params(which="both", direction="in")
ax.spines["top"].set_visible(False)
ax.spines["right"].set_visible(False)
ax.spines["left"].set_linewidth(1.0)
ax.spines["bottom"].set_linewidth(1.0)
fig.show()
fig.savefig(
    f"result/008.png",
    bbox_inches="tight",
    pad_inches=0.1,
)文字とグラフの間隔を変更する

文字とグラフが詰まっている感じをなくす。
ax.set_title(title, fontsize=fontsize_title, pad=fontsize_title * 0.75)
ax.set_xlabel(x_label, fontsize=fontsize_label, labelpad=fontsize_label * 0.75)
ax.set_ylabel(y_label, fontsize=fontsize_label, labelpad=fontsize_label * 0.75)

ax.tick_params(axis="x", labelsize=fontsize_tick, pad=4.5)
ax.tick_params(axis="y", labelsize=fontsize_tick, pad=4.5)文字とグラフの間隔を変更したコード全体
fontsize_title: float = 32.0
fontsize_label: float = 24.0
fontsize_legend: float = 24.0
fontsize_tick: float = 18.0

colors = plt.rcParams["axes.prop_cycle"].by_key()["color"]

plt.rcParams["font.family"] = "Ricty diminished"

fig = plt.figure()
ax = fig.add_subplot(111)
for y in y_data:
    ax.plot(x_data, y, linewidth=3.0, marker="o", markersize=8.0)
ax.set_title(title, fontsize=fontsize_title, pad=fontsize_title * 0.75)
ax.set_xlabel(x_label, fontsize=fontsize_label, labelpad=fontsize_label * 0.75)
ax.set_ylabel(y_label, fontsize=fontsize_label, labelpad=fontsize_label * 0.75)
for index, legend in enumerate(legends):
    x_loc: float = (len(x_data) - 1.0) + len(x_data) * 0.04
    ax.text(
        x_loc,
        ax.lines[index].get_data()[1][-1],
        legend,
        color=colors[index],
        va="center",
        fontsize=fontsize_legend,
    )
ax.tick_params(axis="x", labelsize=fontsize_tick, pad=4.5)
ax.tick_params(axis="y", labelsize=fontsize_tick, pad=4.5)
ax.grid(True, which="both")
ax.set_axisbelow(True)
ax.tick_params(which="both", direction="in")
ax.spines["top"].set_visible(False)
ax.spines["right"].set_visible(False)
ax.spines["left"].set_linewidth(1.0)
ax.spines["bottom"].set_linewidth(1.0)
fig.show()
fig.savefig(
    f"result/009.png",
    bbox_inches="tight",
    pad_inches=0.1,
)色を変更する

背景色やグラフの色などを見やすい色に変更する。
今回、グラフの色には、カラーユニバーサルデザイン推奨配色セット制作委員会により制作された、カラーユニバーサルデザイン推奨配色セットver.4を採用した1。
# colors = plt.rcParams["axes.prop_cycle"].by_key()["color"]color_face: str = "#fafafa"
color_title: str = "#282828"
color_label: str = "#282828"
color_legend: str = "#282828"
color_grid: str = "#c0c0c0"
color_tick: str = "#424242"
colors: list[str] = [
"#005aff",
"#f6aa00",
"#03af7a",
"#ff4b00",
"#9467bd",
"#804000",
"#ff8082",
"#84919e",
"#fff100",
"#4dc4ff",
]
ax.spines["left"].set_color(color_tick)
ax.spines["bottom"].set_color(color_tick)fig = plt.figure(facecolor=color_face)
ax = fig.add_subplot(111)
ax.set_facecolor(color_face)
ax.set_prop_cycle(cycler("color", colors))
ax.set_title(
title,
fontsize=fontsize_title,
pad=fontsize_title * 0.75,
color=color_title,
)
ax.set_xlabel(
x_label,
fontsize=fontsize_label,
labelpad=fontsize_label * 0.75,
color=color_label,
)
ax.set_ylabel(
y_label,
fontsize=fontsize_label,
labelpad=fontsize_label * 0.75,
color=color_label,
)
ax.tick_params(axis="x", labelsize=fontsize_tick, pad=4.5, colors=color_tick)
ax.tick_params(axis="y", labelsize=fontsize_tick, pad=4.5, colors=color_tick)
ax.grid(True, which="both", color=color_grid)色を変更したコード全体
fontsize_title: float = 32.0
fontsize_label: float = 24.0
fontsize_legend: float = 24.0
fontsize_tick: float = 18.0

color_face: str = "#fafafa"
color_title: str = "#282828"
color_label: str = "#282828"
color_legend: str = "#282828"
color_grid: str = "#c0c0c0"
color_tick: str = "#424242"
# NOTE: Reference :
# https://www3.dic-global.com/dic-graphics/navi/color/pdf/cud_guidebook.pdf
colors: list[str] = [
    "#005aff",
    "#f6aa00",
    "#03af7a",
    "#ff4b00",
    "#9467bd",
    "#804000",
    "#ff8082",
    "#84919e",
    "#fff100",
    "#4dc4ff",
]

plt.rcParams["font.family"] = "Ricty diminished"

fig = plt.figure(facecolor=color_face)
ax = fig.add_subplot(111)
ax.set_facecolor(color_face)
ax.set_prop_cycle(cycler("color", colors))
for y in y_data:
    ax.plot(x_data, y, linewidth=3.0, marker="o", markersize=8.0)
ax.set_title(
    title,
    fontsize=fontsize_title,
    pad=fontsize_title * 0.75,
    color=color_title,
)
ax.set_xlabel(
    x_label,
    fontsize=fontsize_label,
    labelpad=fontsize_label * 0.75,
    color=color_label,
)
ax.set_ylabel(
    y_label,
    fontsize=fontsize_label,
    labelpad=fontsize_label * 0.75,
    color=color_label,
)
for index, legend in enumerate(legends):
    x_loc: float = (len(x_data) - 1.0) + len(x_data) * 0.04
    ax.text(
        x_loc,
        ax.lines[index].get_data()[1][-1],
        legend,
        color=colors[index],
        va="center",
        fontsize=fontsize_legend,
    )
ax.tick_params(axis="x", labelsize=fontsize_tick, pad=4.5, colors=color_tick)
ax.tick_params(axis="y", labelsize=fontsize_tick, pad=4.5, colors=color_tick)
ax.grid(True, which="both", color=color_grid)
ax.set_axisbelow(True)
ax.tick_params(which="both", direction="in")
ax.spines["top"].set_visible(False)
ax.spines["right"].set_visible(False)
ax.spines["left"].set_linewidth(1.0)
ax.spines["bottom"].set_linewidth(1.0)
ax.spines["left"].set_color(color_tick)
ax.spines["bottom"].set_color(color_tick)
fig.show()
fig.savefig(
    f"result/010.png",
    bbox_inches="tight",
    pad_inches=0.1,
)あるデータだけ強調する

折れ線グラフの中で注目してほしいデータにだけ色を付ける。 こうすることで、グラフによるメッセージを明確にしやすくなる。
focus_indexes: list[int] = [1]
focus_color: str = colors[1]
not_focus_color: str = "#c3c3c3"

data_num: int = len(y_data)
colors: list[str] = [not_focus_color] * data_num
z_orders: list[int] = [1] * data_num
font_weights: list[str] = ["normal"] * data_num

if focus_indexes is not None and 0 < len(focus_indexes):
    for index, focus_index in enumerate(focus_indexes):
        if data_num <= focus_index:
            raise ValueError(f'"focus_index" {focus_index} is out of range.')
        colors[focus_index] = focus_color
        z_orders[focus_index] = 2
font_weights[focus_index] = "bold"for index, y in enumerate(y_data):
ax.plot(
x_data,
y,
linewidth=3.0,
marker="o",
markersize=8.0,
zorder=z_orders[index],
)
for index, legend in enumerate(legends):
x_loc: float = (len(x_data) - 1.0) + len(x_data) * 0.04
ax.text(
x_loc,
ax.lines[index].get_data()[1][-1],
legend,
color=colors[index],
va="center",
fontsize=fontsize_legend,
fontweight=font_weights[index],
zorder=z_orders[index],
)あるデータだけ強調したコード全体
fontsize_title: float = 32.0
fontsize_label: float = 24.0
fontsize_legend: float = 24.0
fontsize_tick: float = 18.0

color_face: str = "#fafafa"
color_title: str = "#282828"
color_label: str = "#282828"
color_legend: str = "#282828"
color_grid: str = "#c0c0c0"
color_tick: str = "#424242"
colors: list[str] = [
    "#005aff",
    "#f6aa00",
    "#03af7a",
    "#ff4b00",
    "#9467bd",
    "#804000",
    "#ff8082",
    "#84919e",
    "#fff100",
    "#4dc4ff",
]
focus_indexes: list[int] = [1]
focus_color: str = colors[1]
not_focus_color: str = "#c3c3c3"

plt.rcParams["font.family"] = "Ricty diminished"

data_num: int = len(y_data)
colors: list[str] = [not_focus_color] * data_num
z_orders: list[int] = [1] * data_num
font_weights: list[str] = ["normal"] * data_num

if focus_indexes is not None and 0 < len(focus_indexes):
    for index, focus_index in enumerate(focus_indexes):
        if data_num <= focus_index:
            raise ValueError(f'"focus_index" {focus_index} is out of range.')
        colors[focus_index] = focus_color
        z_orders[focus_index] = 2
        font_weights[focus_index] = "bold"

fig = plt.figure(facecolor=color_face)
ax = fig.add_subplot(111)
ax.set_facecolor(color_face)
ax.set_prop_cycle(cycler("color", colors))
for index, y in enumerate(y_data):
    ax.plot(
        x_data,
        y,
        linewidth=3.0,
        marker="o",
        markersize=8.0,
        zorder=z_orders[index],
    )
ax.set_title(
    title,
    fontsize=fontsize_title,
    pad=fontsize_title * 0.75,
    color=color_title,
)
ax.set_xlabel(
    x_label,
    fontsize=fontsize_label,
    labelpad=fontsize_label * 0.75,
    color=color_label,
)
ax.set_ylabel(
    y_label,
    fontsize=fontsize_label,
    labelpad=fontsize_label * 0.75,
    color=color_label,
)
for index, legend in enumerate(legends):
    x_loc: float = (len(x_data) - 1.0) + len(x_data) * 0.04
    ax.text(
        x_loc,
        ax.lines[index].get_data()[1][-1],
        legend,
        color=colors[index],
        va="center",
        fontsize=fontsize_legend,
        fontweight=font_weights[index],
        zorder=z_orders[index],
    )
ax.tick_params(axis="x", labelsize=fontsize_tick, pad=4.5, colors=color_tick)
ax.tick_params(axis="y", labelsize=fontsize_tick, pad=4.5, colors=color_tick)
ax.grid(True, which="both", color=color_grid)
ax.set_axisbelow(True)
ax.tick_params(which="both", direction="in")
ax.spines["top"].set_visible(False)
ax.spines["right"].set_visible(False)
ax.spines["left"].set_linewidth(1.0)
ax.spines["bottom"].set_linewidth(1.0)
ax.spines["left"].set_color(color_tick)
ax.spines["bottom"].set_color(color_tick)
fig.show()
fig.savefig(
    f"result/011.png",
    bbox_inches="tight",
    pad_inches=0.1,
)タイトルの位置を下にする

グラフのタイトルは下に表示するのが慣例であるため、タイトルの位置を上から下に変更する。
ax.set_title(
    title,
    fontsize=fontsize_title,
    pad=fontsize_title * 0.75,
    color=color_title,
    y=-0.45,
)なお、matplotlibでは、タイトルの位置はグラフに対する相対位置でしか指定できない。
そのため、文字の大きさやグラフの大きさによってちょうどいいタイトルの位置は変化してしまう。
ゆえに、これに関しては、グラフごとに適宜指定するしかない。
タイトルの位置を下にしたコード全体
fontsize_title: float = 32.0
fontsize_label: float = 24.0
fontsize_legend: float = 24.0
fontsize_tick: float = 18.0

color_face: str = "#fafafa"
color_title: str = "#282828"
color_label: str = "#282828"
color_legend: str = "#282828"
color_grid: str = "#c0c0c0"
color_tick: str = "#424242"
colors: list[str] = [
    "#005aff",
    "#f6aa00",
    "#03af7a",
    "#ff4b00",
    "#9467bd",
    "#804000",
    "#ff8082",
    "#84919e",
    "#fff100",
    "#4dc4ff",
]
focus_indexes: list[int] = [1]
focus_color: str = colors[1]
not_focus_color: str = "#c3c3c3"

plt.rcParams["font.family"] = "Ricty diminished"

data_num: int = len(y_data)
colors: list[str] = [not_focus_color] * data_num
z_orders: list[int] = [1] * data_num
font_weights: list[str] = ["normal"] * data_num

if focus_indexes is not None and 0 < len(focus_indexes):
    for index, focus_index in enumerate(focus_indexes):
        if data_num <= focus_index:
            raise ValueError(f'"focus_index" {focus_index} is out of range.')
        colors[focus_index] = focus_color
        z_orders[focus_index] = 2
        font_weights[focus_index] = "bold"

fig = plt.figure(facecolor=color_face)
ax = fig.add_subplot(111)
ax.set_facecolor(color_face)
ax.set_prop_cycle(cycler("color", colors))
for index, y in enumerate(y_data):
    ax.plot(
        x_data,
        y,
        linewidth=3.0,
        marker="o",
        markersize=8.0,
        zorder=z_orders[index],
    )
ax.set_title(
    title,
    fontsize=fontsize_title,
    pad=fontsize_title * 0.75,
    color=color_title,
    y=-0.45,
)
ax.set_xlabel(
    x_label,
    fontsize=fontsize_label,
    labelpad=fontsize_label * 0.75,
    color=color_label,
)
ax.set_ylabel(
    y_label,
    fontsize=fontsize_label,
    labelpad=fontsize_label * 0.75,
    color=color_label,
)
for index, legend in enumerate(legends):
    x_loc: float = (len(x_data) - 1.0) + len(x_data) * 0.04
    ax.text(
        x_loc,
        ax.lines[index].get_data()[1][-1],
        legend,
        color=colors[index],
        va="center",
        fontsize=fontsize_legend,
        fontweight=font_weights[index],
        zorder=z_orders[index],
    )
ax.tick_params(axis="x", labelsize=fontsize_tick, pad=4.5, colors=color_tick)
ax.tick_params(axis="y", labelsize=fontsize_tick, pad=4.5, colors=color_tick)
ax.grid(True, which="both", color=color_grid)
ax.set_axisbelow(True)
ax.tick_params(which="both", direction="in")
ax.spines["top"].set_visible(False)
ax.spines["right"].set_visible(False)
ax.spines["left"].set_linewidth(1.0)
ax.spines["bottom"].set_linewidth(1.0)
ax.spines["left"].set_color(color_tick)
ax.spines["bottom"].set_color(color_tick)
fig.show()
fig.savefig(
    f"result/012.png",
    bbox_inches="tight",
    pad_inches=0.1,
)最終的にできたコード

これで最初に示した結論と同じコードができた。とても長い。
Afterのグラフを表示するコード
from matplotlib import pyplot as plt
from numpy.typing import ArrayLike
from cycler import cycler

fontsize_title: float = 32.0
fontsize_label: float = 24.0
fontsize_legend: float = 24.0
fontsize_tick: float = 18.0

color_face: str = "#fafafa"
color_title: str = "#282828"
color_label: str = "#282828"
color_legend: str = "#282828"
color_grid: str = "#c0c0c0"
color_tick: str = "#424242"
colors: list[str] = [
    "#005aff",
    "#f6aa00",
    "#03af7a",
    "#ff4b00",
    "#9467bd",
    "#804000",
    "#ff8082",
    "#84919e",
    "#fff100",
    "#4dc4ff",
]
focus_indexes: list[int] = [1]
focus_color: str = colors[1]
not_focus_color: str = "#c3c3c3"

plt.rcParams["font.family"] = "Ricty diminished"

data_num: int = len(y_data)
colors: list[str] = [not_focus_color] * data_num
z_orders: list[int] = [1] * data_num
font_weights: list[str] = ["normal"] * data_num

if focus_indexes is not None and 0 < len(focus_indexes):
    for index, focus_index in enumerate(focus_indexes):
        if data_num <= focus_index:
            raise ValueError(f'"focus_index" {focus_index} is out of range.')
        colors[focus_index] = focus_color
        z_orders[focus_index] = 2
        font_weights[focus_index] = "bold"

fig = plt.figure(facecolor=color_face)
ax = fig.add_subplot(111)
ax.set_facecolor(color_face)
ax.set_prop_cycle(cycler("color", colors))
for index, y in enumerate(y_data):
    ax.plot(
        x_data,
        y,
        linewidth=3.0,
        marker="o",
        markersize=8.0,
        zorder=z_orders[index],
    )
ax.set_title(
    title,
    fontsize=fontsize_title,
    pad=fontsize_title * 0.75,
    color=color_title,
    y=-0.45,
)
ax.set_xlabel(
    x_label,
    fontsize=fontsize_label,
    labelpad=fontsize_label * 0.75,
    color=color_label,
)
ax.set_ylabel(
    y_label,
    fontsize=fontsize_label,
    labelpad=fontsize_label * 0.75,
    color=color_label,
)
for index, legend in enumerate(legends):
    x_loc: float = (len(x_data) - 1.0) + len(x_data) * 0.04
    ax.text(
        x_loc,
        ax.lines[index].get_data()[1][-1],
        legend,
        color=colors[index],
        va="center",
        fontsize=fontsize_legend,
        fontweight=font_weights[index],
        zorder=z_orders[index],
    )
ax.tick_params(axis="x", labelsize=fontsize_tick, pad=4.5, colors=color_tick)
ax.tick_params(axis="y", labelsize=fontsize_tick, pad=4.5, colors=color_tick)
ax.grid(True, which="both", color=color_grid)
ax.set_axisbelow(True)
ax.tick_params(which="both", direction="in")
ax.spines["top"].set_visible(False)
ax.spines["right"].set_visible(False)
ax.spines["left"].set_linewidth(1.0)
ax.spines["bottom"].set_linewidth(1.0)
ax.spines["left"].set_color(color_tick)
ax.spines["bottom"].set_color(color_tick)
fig.show()
fig.savefig(
    f"result/012.png",
    bbox_inches="tight",
    pad_inches=0.1,
)ちなみに

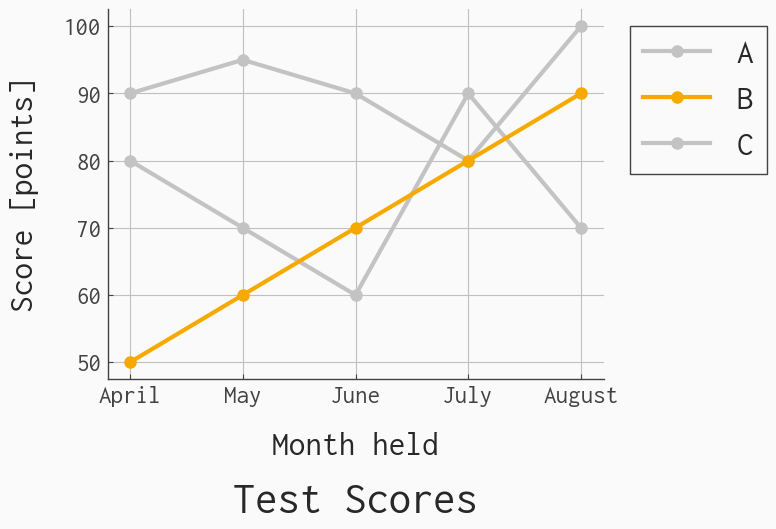
凡例を埋め込みたくない場合

凡例をグラフに埋め込みたくない場合は、凡例を外に出すとよい。
# for index, legend in enumerate(legends):
#     x_loc: float = (len(x_data) - 1.0) + len(x_data) * 0.04
#     ax.text(
#         x_loc,
#         ax.lines[index].get_data()[1][-1],
#         legend,
#         color=colors[index],
#         va="center",
#         fontsize=fontsize_legend,
#         fontweight=font_weights[index],
#         zorder=z_orders[index],
# )ax.legend(
legends,
fancybox=False,
bbox_to_anchor=(1.02, 1.0),
loc="upper left",
fontsize=fontsize_legend,
facecolor=color_face,
labelcolor=color_legend,
edgecolor=color_tick,
framealpha=1.0,
)背景を透明にしたい場合

背景をプレゼン資料の背景と合わせるには、背景色を指定するほかに、保存時に背景を透明にするという手もある。
fig.savefig(
    f"result/013-b.{fig_ext}",
    bbox_inches="tight",
    pad_inches=0.1,
    transparent=True,
)おわりに

この長々したコードをいちいちコピペして加工するのが面倒になったので、パッケージ化した。 PyCoolPlotもいいぞ。
参考文献・URL

- 表とグラフ
- (1) データ視覚化のデザイン図解まとめ / Twitter
- Customizing Plots with Python Matplotlib | by Carolina Bento | Towards Data Science
- Matplotlibで綺麗な論文用のグラフを作る - Qiita
これはカラーユニバーサルデザイン推奨配色セット ガイドブック 第2版に載っている。 ↩︎


